Description
- This article targets nonprofessionals or the beginners who are not familiar to the data science.
- I explain the common mistakes on data-analyzing for nonprofessionals, not to be deceived by wrong data-analyzing reports and for beginners not to acquire bad knowledge.
- I wrote this article as my English language training.
Some years have passed since the data science, big data, or other words occurred. Nowadays a lot of information about data science is found on the internet and books; statistical inference, causal inference, Bayesian statistics, machine learning, deep learning and Artificial Intellectual. Many people want to learn the data science on his own, and many companies employ the data scientists or ask the data science consultants for analyzing their own data.
However, it is hard and takes much time to understand data science methodologies deeply, so you may
misuse the data science methods even without malice, and someone may
abuse that with malice. You also may be deceived by malicious someone who abuse the data science methods.
Hence, in this article, I described what is the bad data science practice, and what is the not-bad one. I wrote this article targeting the nonprofessionals who ask the data scientists or data science consultants for analyzing his company’s data. But I also recommend reading this article for those who start to learn the data science, and for those who are using any analytics software yet don’t know theoretical foundations.
The examples of misuses in this articles are from my private/work experience. But I did not write what had actually happened and modified the details, so I did not meant to disparage any person or any organization. I did wrote this article to hope in my very soul that
the right data science methodologies spread and contribute to human society.
This article consists of 4 sections: Section 1 is the description. In section 2, I briefly explain the fundamental concept of “analysis.” In section 3, I describe three examples of bad data analyzing and prescription for it. Section 4 is summary and conclusions of this article.
What Is the Analysis
At first, we need to clarify the meaning of the word “analysis.” A dictionary says the word “analysis” means the followings:
- the separating of any material or abstract entity into its constituent elements (opposed to synthesis ).
- this process as a method of studying the nature of something or of determining its essential features and their relations: the grammatical analysis of a sentence.
- a presentation, usually in writing, of the results of this process: The paper published an analysis of the political situation.
http://www.dictionary.com/browse/analysis
However, my definition of “analysis” is different from the above. In my thought, these definitions refer the concept of “deduction.” My definition of “analysis” is much closer to the concept of “abduction” or “retroduction,” which is introduced by C. S. Peirce than the above definitions. Briefly, I state the definition of the analysis (you must be bored with such abstract and non-practical discussion):
the process of creating hypothesis and validating it, or repeat of this process some times.
In the context of data science (empirical science), It is impossible to separate strictly the problem into constituent elements because the data contains any inseparable error/noise components arising by any reason. Analysis which is in the lexical meaning is suitable for noiseless formal logical or thought experimental problems. On the other hand, This is not suitable for the noise-containing empirical problems. For example, do you know “Hempel’s ravens?” In this universe, some excepts can occur by chance. We cannot state sentences determinedly. This is the reason why I redefine the word “analysis.”
Are we unavailable to analysis the problem and reach the correct answer because we cannot get rid of the noise from the data? No. Actually, analysis isn’t able to lead us to the correct answer. However, analysis is able to says the probability of correctness of the hypothesis. Primary, we make an idea as a hypothesis. Our idea is still just a hypothesis. Secondary, we think the consequences when the hypothesis is true. If the hypothesis is true, this consequences coincide with the reality. If so, we can says “the hypothesis is
probably true.” This part is what we call “validation.” The validation part is a essential component of analysis. To strictly validate the hypothesis makes you to get rid of your subjective judgement or sales staffs’ exaggerated reports. However, we still cannot say “the hypothesis is
determindly true/false.”
Two Measurements of Error in Data Science
Q.: Can we know how much probability our hypothesis is true/false? A.: Data science makes you to calculate the degrees of error of your hypothesis. This is a great advantage of data science. Now, we can select the model which has less errors and we can say “this hypothesis is more close to the truth.”
Although there are some differences between statistics and machine learning methodologies, there is at least one common point: It is that there are two kind of measurements of error.
The first measurement is the
goodness of fit. It denotes how much errors the hypothesis contains when it explains the data. It is also called “internal validity.”
The second is the
precision of prediction. It denotes how much errors the hypothesis contains when it explains the future data that we will get next week/month/year, or the data of potential customers. It is also called “external validity” or “generalization ability.”
Both of two measurements make the analysis rigorous. Once you ignore at least one of these essential factors, your analysis report doesn’t become
RIGOROUS, but
RIDICULOUS, even if your data scientist/consultant uses decision tree/deep neural network/ensemble learning/other intricate methods. But in usually, to improve the precision of prediction is more difficult than to improve the other.

https://xkcd.com/605/
To Keep Yourself not Being Deceived by Ridiculous Analysis
You must carefully listen to the data scientists report. A fair data scientist does validate the hypothesis objectively, does not validate with his subjective judgement common sense. Though, this advise is too abstract for nonprofessionals to do practice. So I explain the following three famous examples.
Example #1: Cluster Analysis
The cluster analysis provides intuitive graphics such that the tree diagram, and looks persuasive, but this is the very pitfall. The cluster analysis is
not able to validate itself, and thus, strictly it is not analysis.
In detail, although there are some indices of goodness of fit on the cluster analysis, these are valid only under some premises, and it is difficult to check them. Beginners often tend to validate it whether
it fits his own sense, but such usage is not analysis.
For example, k-means method, one of the most popular cluster methods is assume that each sample point is distributed normally with the mean which is equal to the center of a cluster that it belongs to. This assumption implies that any cluster is circle, but who validated that? Can you assert that the shape of clusters are not oval, torus, vortex, or other complex figure?
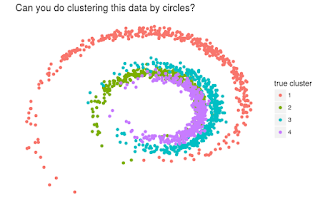
Thus, if the report consists from only cluster analysis and author’s conclusions, you should better to doubt greatly. I interpret that the cluster analysis only plays a role in path finding of insight to data for further analyzing, or it can only make a hypothesis, and you need to monitor the forthcoming data and validate its hypothesis.
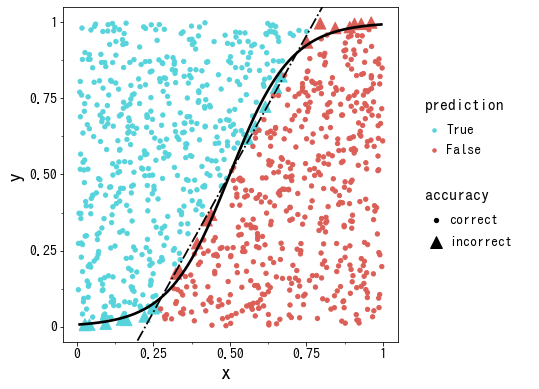
Example #2: Regression Analysis
The regression analysis is so popular as the cluster analysis, yet unlike the cluster analysis, we can validate the regression with both types of measurements: We can use the coefficient of determination (aka R2, or R-squared) for goodness of fit, and the information criterion (AIC or BIC, or so on) for precision of prediction.
The regression analysis is also able to be abused: Excessive number of variables cause much excellent goodness of fit and very poor precision of prediction simultaneously. This phenomenon is called
overfitting or
overlearning. The following figure is one of the overfitting examples. if you predict the future (since 1997) stock index by a cubic polynomial, the prediction curve is drawn nearby the actual values, so its precision is not so bad. On the other hand, if you predict that by a polynomial of degree six, the curve fits the actual values better than the other by 1997, but it clearly derails since 1997. To avoid to abuse/misuse the regression analysis, we need to check that the presenter shows the precision of prediction in, for example, AIC or BIC, not only R2.
Example #3: Hypothesis Testing
The hypothesis testing is also as popular as the above two methods. In particular, testing difference between means is very simple and useful to infer the effect of your sales promotion.
However, this method has two major shortages; (1) it is not able to calculate the precision of prediction, and (2) its theoretical complexity makes beginners to misunderstanding that. The hypothesis testing is an in-sample method, so it judges the hypothesis by only current data and does not guarantee the future. I come up with four typical examples of misunderstanding.
- To accept the hypothesis (He can misunderstand the significance level and the power).
- To interpret the p-value as the size of the effect (p-value is not able to show the size of effect).
- Tuning the sample size or the significance level until he gets a result which he want to show, to repeat testing (It’s cheating!).
- Without any adjustment, To show multiple testing result simultaneously (He can misunderstand basic joint probability).
However, because of its complexity, its explanation becomes too long to write here. I will write that someday if I get time.
Summary and Conclusions
It is better to carefully hear how the presenter validate his model. If he only emphasize that we use the super best method of the machine learning, the deep learning or other up-to-date cool techniques ever seen, you should better to be more careful.
There are other check points of sound data science practices, but I cannot enumerate all of them because of profoundness of data science.
Finally, I repeatedly state the essential points of this article.
1. Analysis is the repeating of two-stage process to decrease the error of our notion. The first stage is to make a hypothesis, and the second is to validate the hypothesis. Any of both is essential.
2. In the context of the data science, there are two types of measurement of error. They are the goodness of fit and the precision of prediction.
3. It is difficult to validate the result of the cluster analysis. A good data scientist knows the technical limit of it. He can interpret the result properly and explain its defect. if he would explain just like that the hypothesis from clustering is already verified, you should better to be much careful.
4. It is very important to see both the goodness of fit and the precision of prediction in the context of the regression analysis. If the presenter show only the former (usually in R2), you should better to request him to show the latter.
5. The hypothesis testing is quite simple but is not able to predict. In addition, we can often misunderstand its usage because of the complexity of its theoretical foundation. There are some major typical mistakes about the hypothesis testing. Why don’t have to attend the meeting with the above checklist?
Written with StackEdit.